Hello all, first off thank you for your hard work providing this tool to the community! It's a very useful, interesting addition.
I've attempted to apply the pipeline to our ATAC-seq data on an experiment with two conditions, A and B with two bioreps per condition. I opted for the config file input type. I first ran Condition 1 = A and Condition 2 = B, plotall=TRUE completing the pipeline in ~7-8 hours. I then attempted Condition 1 = B, Condition 2= A plotall=FALSE and the run completed in 2 days and 6 hours on the same machine. I expected the output to be identical with opposite signs for the calculated E-score on the respective transcription factors, however the outputs differed significantly as did the p-values.
I am copying both config and results files here.
tfea_config_Run1.txt
tfea_config_Run1.txt
results_Run1.txt
results_Run2.txt
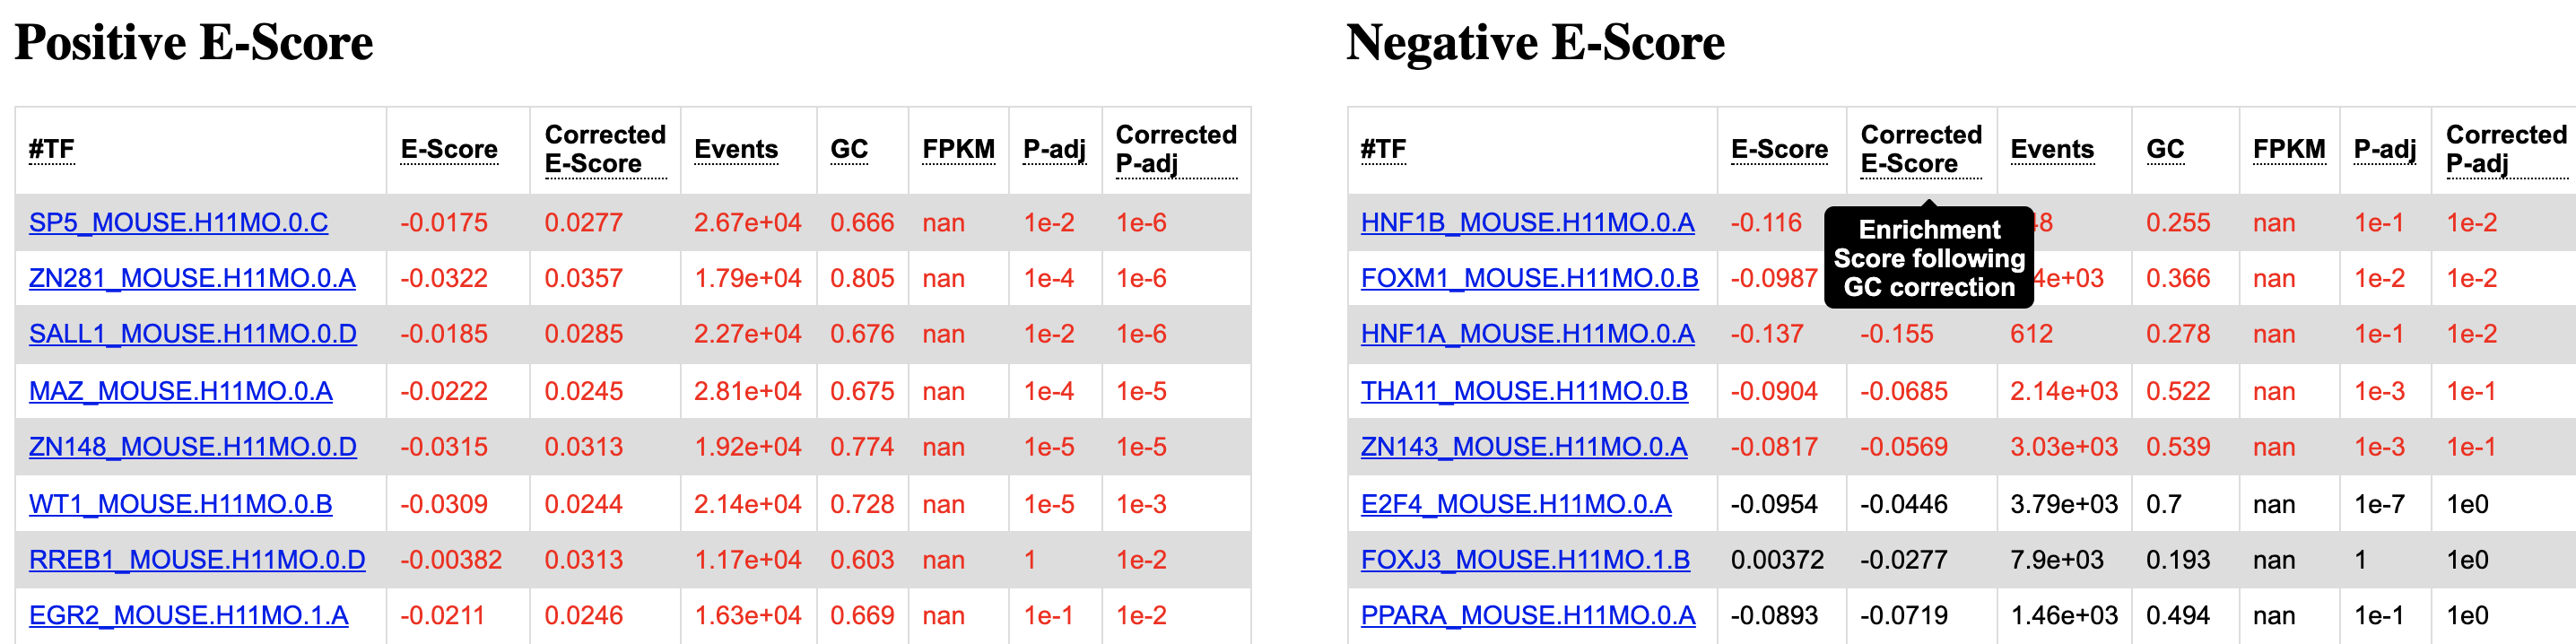
To aid in comparing the different results, I've copied the top of the results.html tables here.
Run 1:
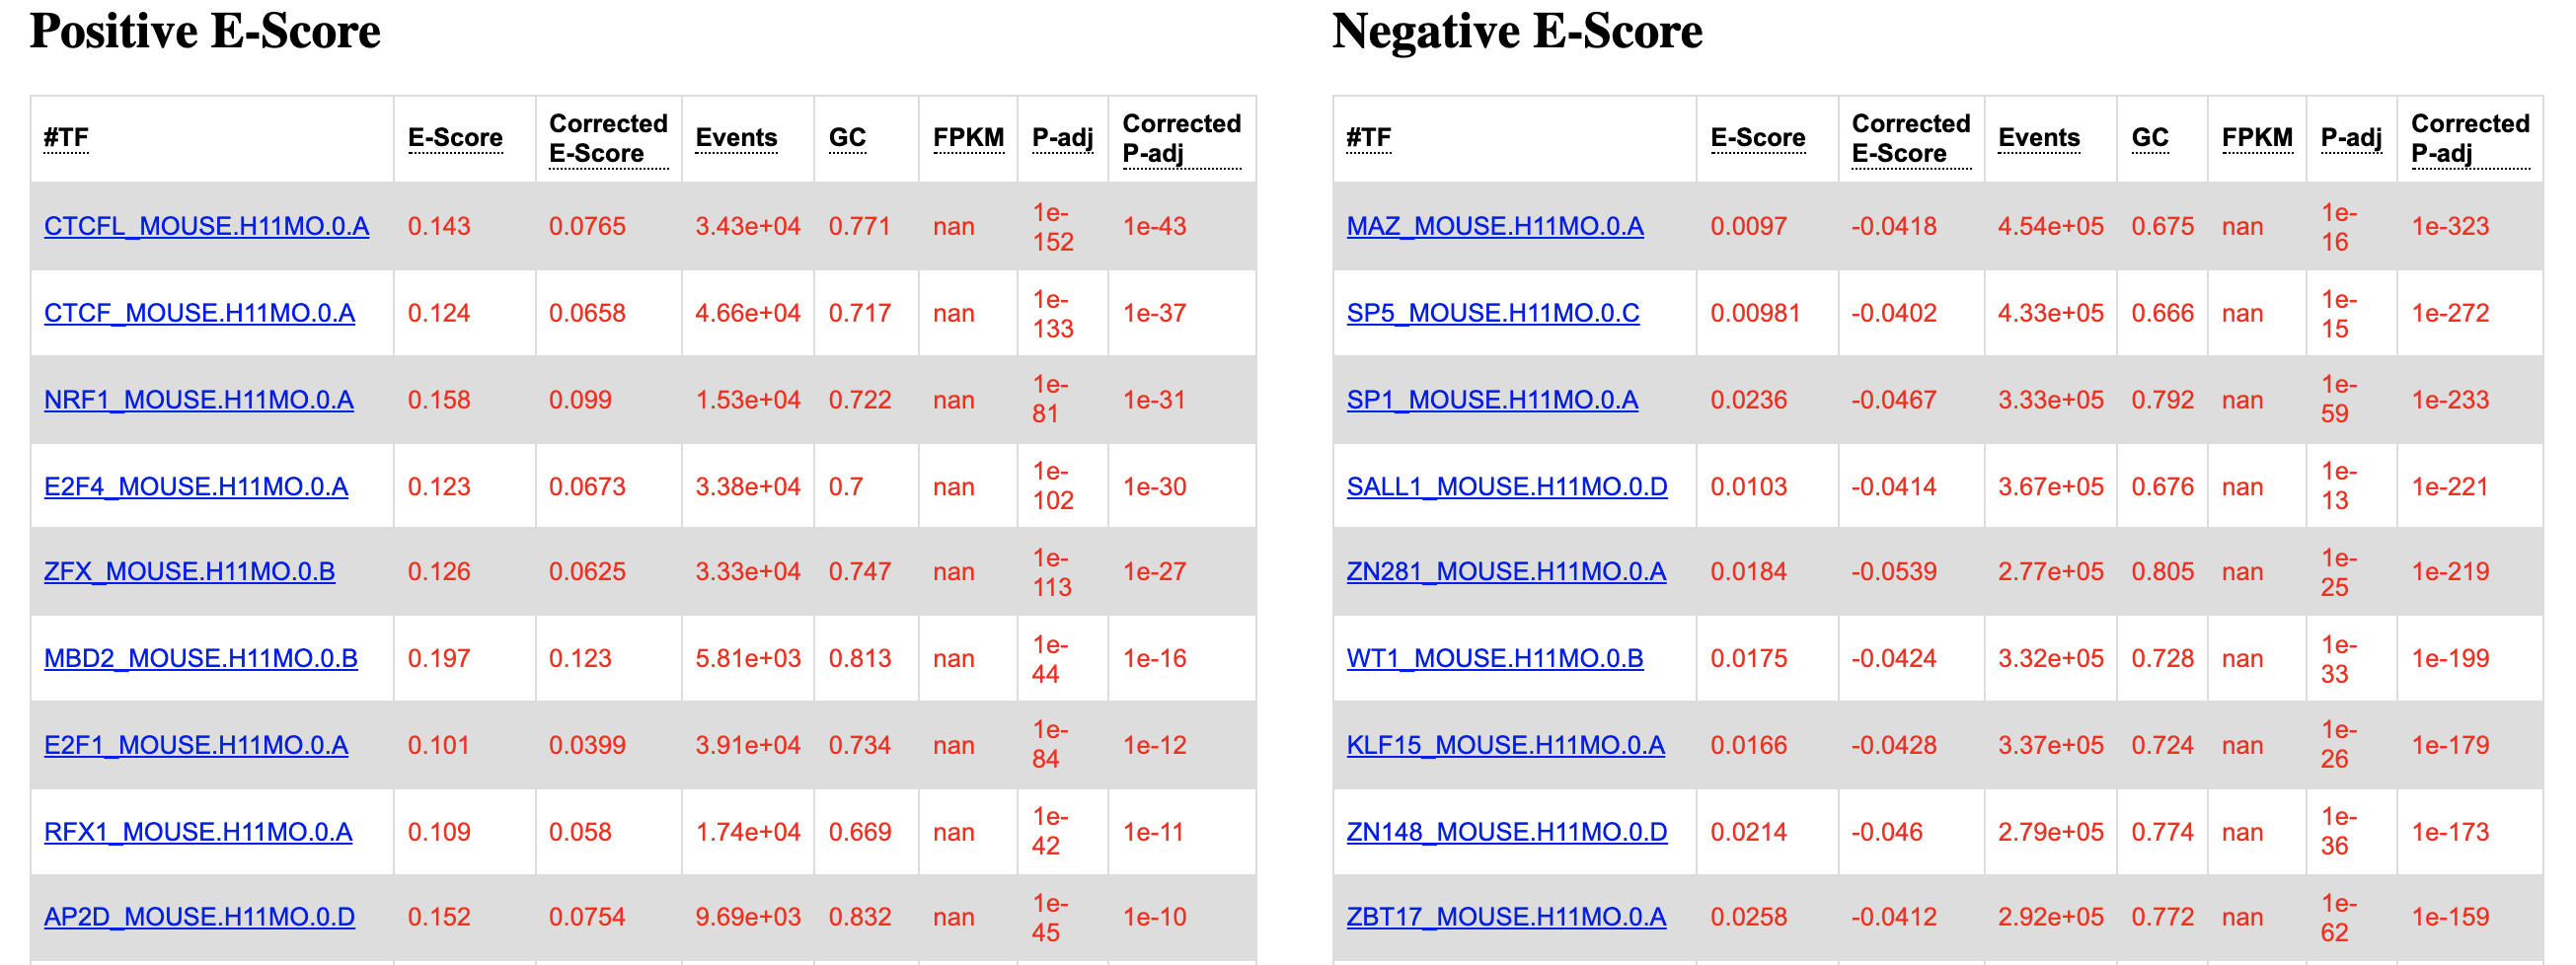
Run 2: (note: the expectation is the identical table from above with the positive E-score table in Run 2 matching the negative E-score table in Run 1, and vice versa).
I'd greatly appreciate any help understanding this issue, I'm still a novice when it comes to bioinformatics.
Hello all, first off thank you for your hard work providing this tool to the community! It's a very useful, interesting addition.
I've attempted to apply the pipeline to our ATAC-seq data on an experiment with two conditions, A and B with two bioreps per condition. I opted for the config file input type. I first ran Condition 1 = A and Condition 2 = B, plotall=TRUE completing the pipeline in ~7-8 hours. I then attempted Condition 1 = B, Condition 2= A plotall=FALSE and the run completed in 2 days and 6 hours on the same machine. I expected the output to be identical with opposite signs for the calculated E-score on the respective transcription factors, however the outputs differed significantly as did the p-values.
I am copying both config and results files here.
tfea_config_Run1.txt
tfea_config_Run1.txt
results_Run1.txt
results_Run2.txt
To aid in comparing the different results, I've copied the top of the results.html tables here.

Run 1:
Run 2: (note: the expectation is the identical table from above with the positive E-score table in Run 2 matching the negative E-score table in Run 1, and vice versa).

I'd greatly appreciate any help understanding this issue, I'm still a novice when it comes to bioinformatics.