Conversation
VeraZab
force-pushed
the
date-axis
branch
4 times, most recently
from
December 11, 2018 21:44
cc6d4ea to
868fa0d
Compare
VeraZab
force-pushed
the
date-axis
branch
3 times, most recently
from
December 12, 2018 16:38
de6a072 to
537e73f
Compare
VeraZab
force-pushed
the
date-axis
branch
3 times, most recently
from
December 12, 2018 17:36
986844f to
f45f92d
Compare
Contributor
Author
|
@nicolaskruchten @dmt0 ready for review I will tackle issue 803 incrementally |
dmt0
reviewed
Dec 12, 2018
dmt0
reviewed
Dec 12, 2018
Contributor
|
💃 for the code |
| plotProps.fullValue = plotProps.fullValue.substring(1); | ||
| plotProps.min = 1; | ||
| plotProps.max = 12; | ||
| plotProps.units = parseInt(plotProps.fullValue, 10) === 1 ? _('Month') : _('Months'); |
Contributor
There was a problem hiding this comment.
does plotly.js accept any other format than M for months? D for days? seconds? I'd be surprised if it was only months :)
Contributor
Author
There was a problem hiding this comment.
Well actually, from the docs, it does look that months is the only option:
https://plot.ly/javascript/reference/#layout-yaxis-dtick
If the axis `type` is "date", then you must convert the time to milliseconds. For example, to set the interval between ticks to one day, set `dtick` to 86400000.0. "date" also has special values "M<n>" gives ticks spaced by a number of months. `n` must be a positive integer. To set ticks on the 15th of every third month, set `tick0` to "2000-01-15" and `dtick` to "M3". To set ticks every 4 years, set `dtick` to "M48"
Either that or time in milliseconds, so I could add a richer widgets that allows to do either milliseconds or months
Contributor
There was a problem hiding this comment.
Call me "surprised" :)
Contributor
|
Should we actually bake |
Merged
This file contains hidden or bidirectional Unicode text that may be interpreted or compiled differently than what appears below. To review, open the file in an editor that reveals hidden Unicode characters.
Learn more about bidirectional Unicode characters
Sign up for free
to join this conversation on GitHub.
Already have an account?
Sign in to comment
3 participants
Add this suggestion to a batch that can be applied as a single commit.This suggestion is invalid because no changes were made to the code.Suggestions cannot be applied while the pull request is closed.Suggestions cannot be applied while viewing a subset of changes.Only one suggestion per line can be applied in a batch.Add this suggestion to a batch that can be applied as a single commit.Applying suggestions on deleted lines is not supported.You must change the existing code in this line in order to create a valid suggestion.Outdated suggestions cannot be applied.This suggestion has been applied or marked resolved.Suggestions cannot be applied from pending reviews.Suggestions cannot be applied on multi-line comments.Suggestions cannot be applied while the pull request is queued to merge.Suggestion cannot be applied right now. Please check back later.
part of #803
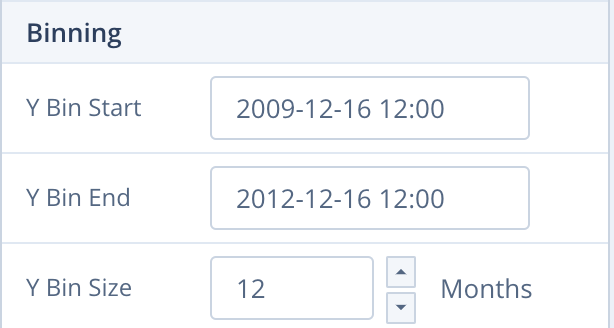
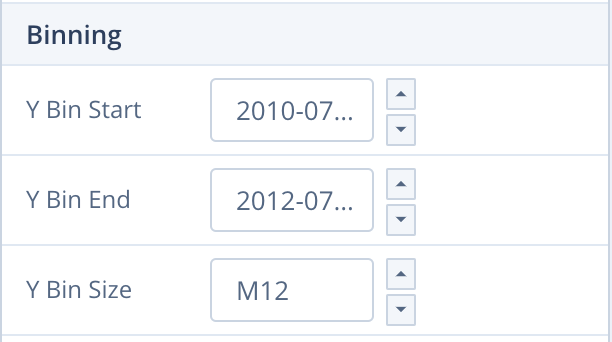
Adjusts AxesRange and allows to detect when fullValue is date so that proper control showsbefore
after